Below is a description of the various tools available on the Medtrix platform.
PROJECTS
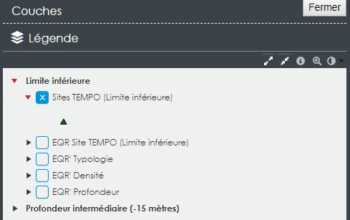
LEGEND
The “Legend” tool allows the user to view the project legend and manage (make visible or not) the various GIS layers (shapefile) of the project by ticking/unticking the data. In the legend, users can access documentation by clicking on the “i” icon (e.g. access to the MAGMA project mission reports) and by hovering over certain elements with the mouse. Available for all projects.
INFORMATION
The “Information” tool displays information about the project (description, partner structure(s), access to methodological documents and associated reports). Available for all projects.

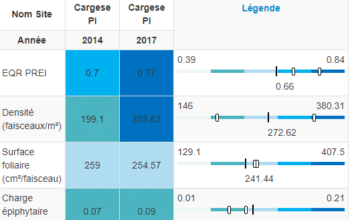
COMPARE
The “Compare” tool is used in the TEMPO, RECOR, RESPIRE, SURFSTAT, PISCIS and LAGMED projects. It allows parameters to be compared for each site (PISCIS, RECOR, RESPIRE, TEMPO) or coastal water body (LAGMED, SURFSTAT) at different scales of comparison (Mediterranean, Region, Coastal water body). The tool compares the sites/water bodies visible on the map and exports the results in the form of a table.
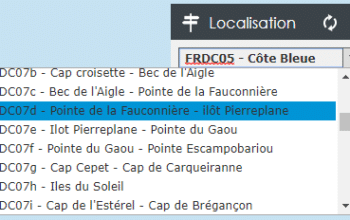
LOCATION
The “Location” tool enables the user to locate an area by zooming in on a body of water. Available for all projects.
GEOLOCATION
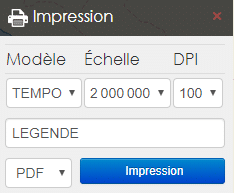
PRINTING
The “Print” tool allows the user to print the map in PDF format by choosing the print scale, the map resolution (100, 200 or 300 DPI), the legend title (optional) and the print area. The map opens in a new tab in PDF format. Available for all projects.
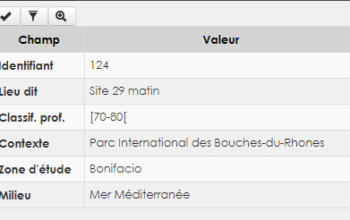
POPUP
The “POPUP” tool allows you to display a “POPUP” window on the left of the map by clicking on different elements of the map (sites, images). Available on most projects.
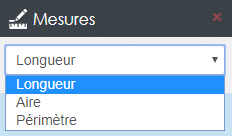
MEASURE
The “Measure” tool lets users measure distances, areas and perimeters on the map. Available on all projects.
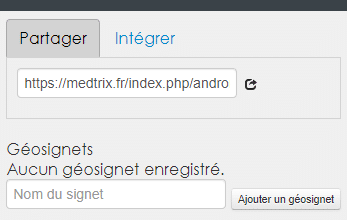
PERMALIEN
The “Permalink” tool, used to share a right-of-way and the map’s active layers, generates an Internet link. The Geobookmarks tab lets you save a bookmark (= a right-of-way with layers displayed) for a given project and return to it when you connect to the project again – a bookmark is specific to each user. Available for all projects.
FILTER
The “Filter“ tool allows the user to filter the map dynamically (live) from the database.
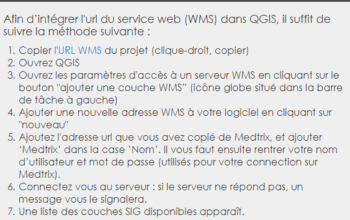
USING WMS
The “WMS” tool enables the user to retrieve the WMS stream (georeferenced data in the form of an image file) by integrating the WMS URL of the project on medtrix into your Geographic Information System (QGIS, ARCGIS). Available for all projects.
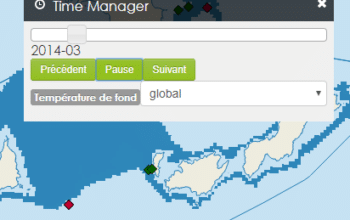
TIME MANAGER
The “Time manager” tool, which displays an animation based on a temporal attribute of a given layer, allows the user to follow the evolution of a parameter over time. Available on the CALOR project for monitoring temperature in the Mediterranean.
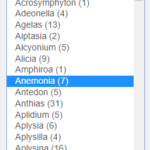
SEARCH
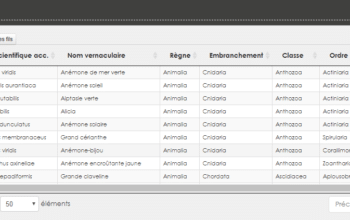
The “Search” tool allows you to carry out an in-depth search of the database using specific filtering.
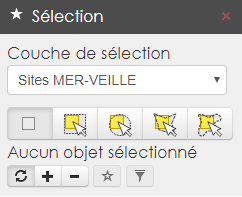
SELECTION
The “Selection“ tool allows the user to select an area of interest on the map and display only the data relating to that area.
SIGNAL
The “Report” tool enables users to report any display or data errors, and to pass the information on to the Medtrix platform managers. Available for all projects.

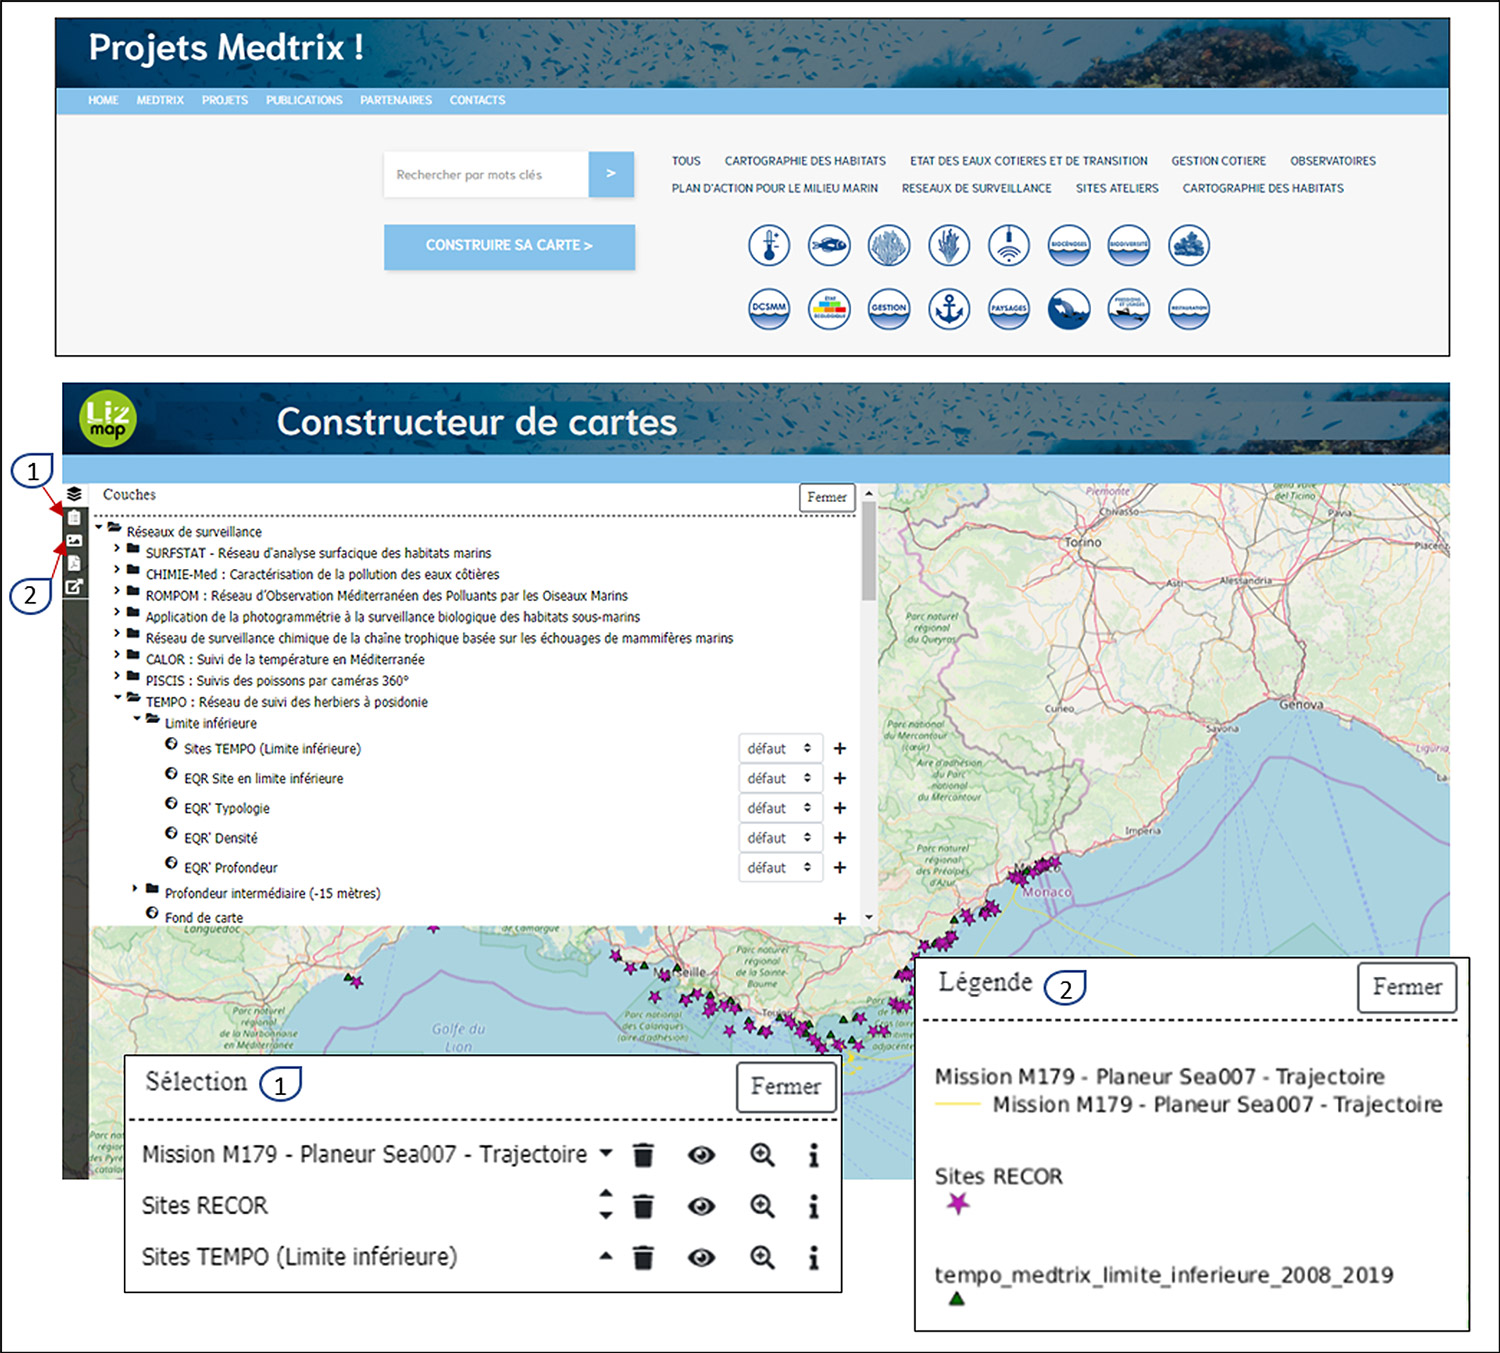
The addition of a “build your map” function
Users can now build their own map in a dedicated project by combining the layers available in MEDTRIX. They can enable/disable layer visibility, change transparency, change style and change order. They can also add a title and export their map as a PDF using the print tool.
To add the chosen layer to the map, simply click on the + (once is enough). If the data does not appear immediately, this means that it is either in the process of being loaded, or can simply be seen by zooming in.